Reporter Basics
The basic steps to using Evergreen’s reporter are:
-
Create a template. See Creating Report Templates.
-
Alternatively, find a template and clone it into your folders if it was created by another user. See Cloning Report Templates.
-
-
Run the report, also referred to as creating a report definition.
-
View your output either through the staff client or via your email.
Running a Report
You can run one-off reports on demand or schedule recurring reports to run automatically. To run the report, you fill out the reports form to create a report definition, which tells Evergreen how to run the report, what information to include, and what type of output to provide you with.
-
Navigate to Administration → Reports.
-
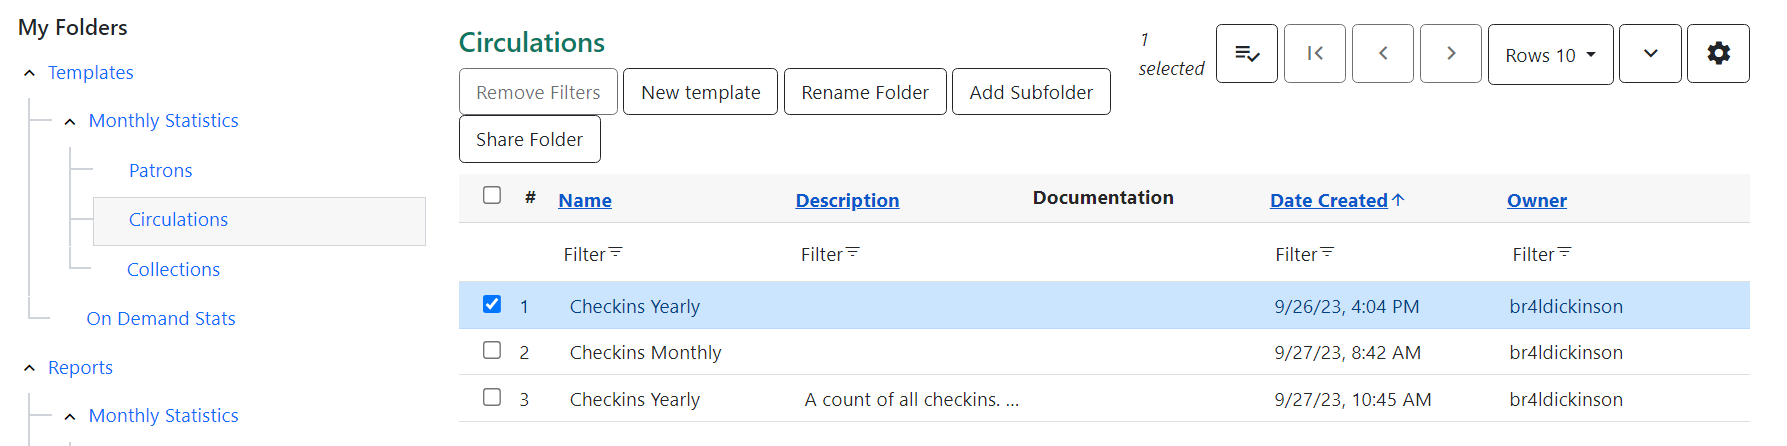
In the My Folders section at the left of the screen, select the caret beside the Templates folder to see your template folders. Use the carets to expand the folder tree until you find the folder containing the template you would like to use for your report.
-
Select a folder name to display the contents.
-
Double click on the desired template name or check the box beside the template you wish to use and then right click or use the Actions menu to select New Report.
-
Enter a name for your report. Report names must be unique, or the report cannot be saved.
A best practice for naming reports is to use the same name as the template you used. This makes it easy to track outputs and reports back to the template used. If multiple reports are made from the same template, the format of 'template name' - 'report characteristic' can make those reports easy to track.
-
Optionally, enter a description for your report.

-
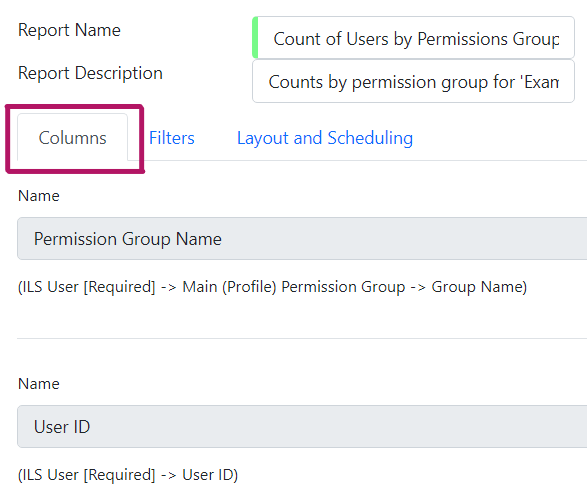
The display columns selected in the template are listed on the Columns tab. You can navigate between tabs by clicking on the tabs or by using the Previous and Next buttons at the bottom of the screen.
-
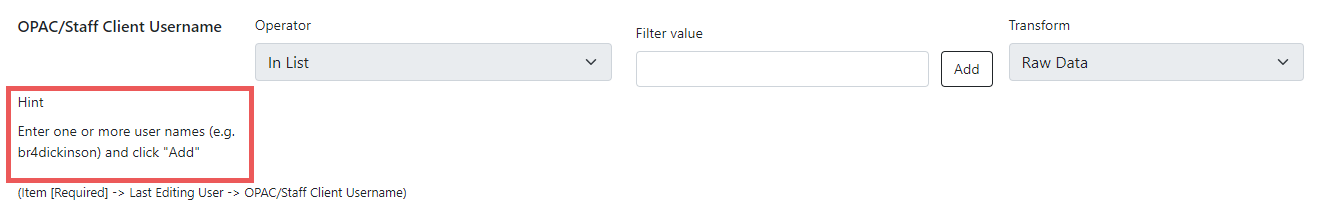
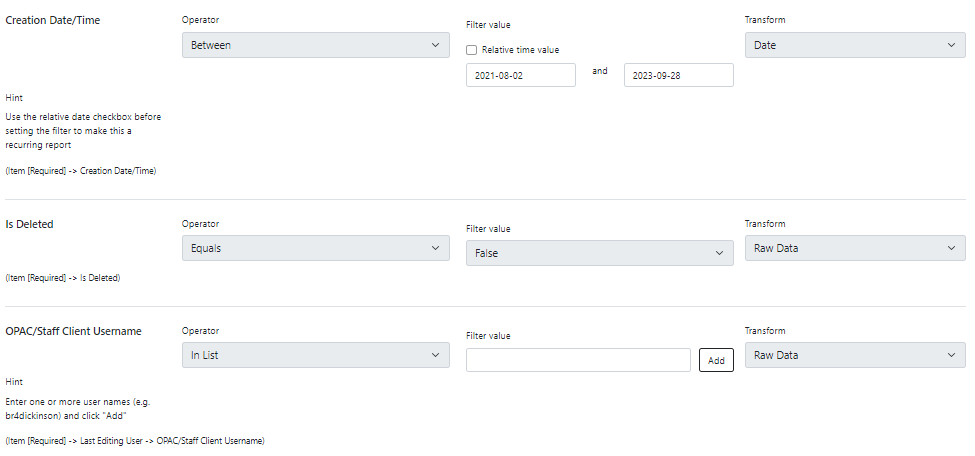
On the Filters tab, enter values for any filters. For more information on filter values, see Report Filters, below.
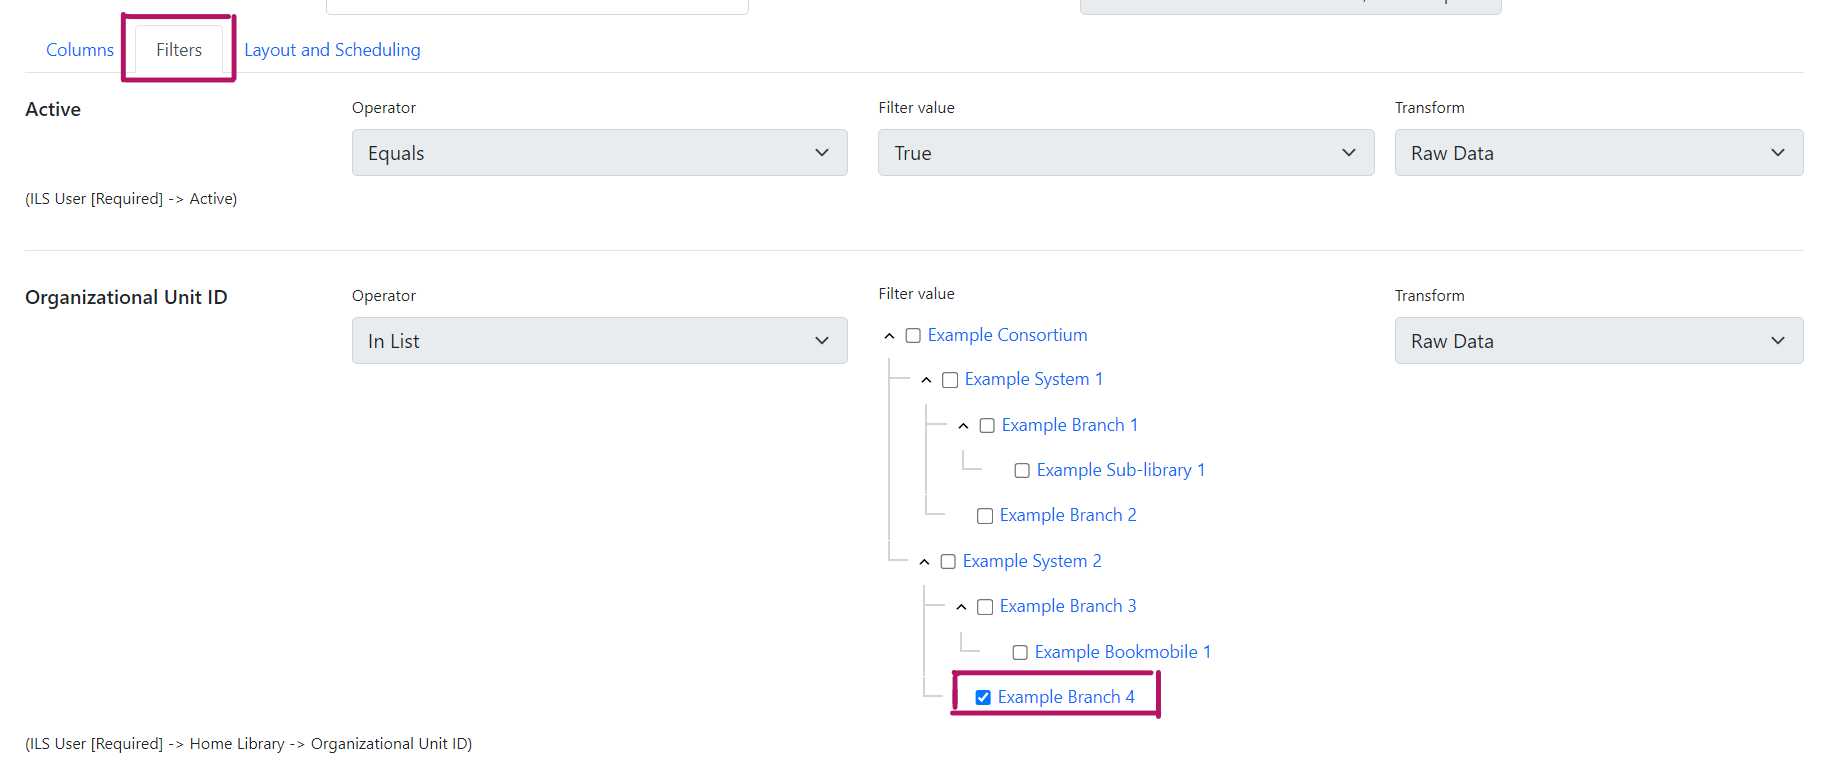
Instead of scrolling through the options in the filter lists, you can place your cursor in the filter value box and then on your keyboard start typing the first few letters that the option you want starts with. This will limit your list to just those options that match what you have typed.
Make sure you use the Add button after choosing each filter value to actually add it to your filter choices.
-
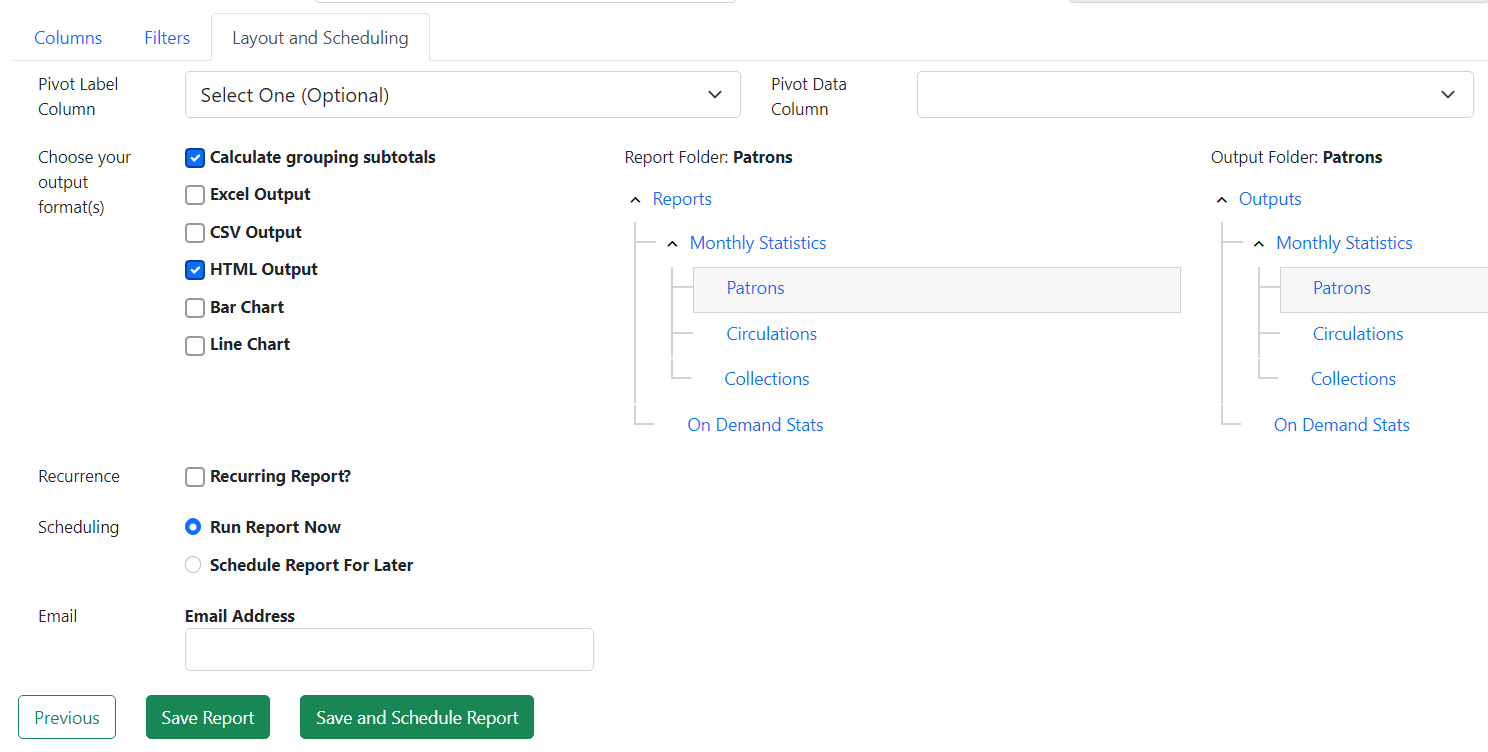
On the Layout and Scheduling tab you can make a number of choices about the final output.
-
Pivot Label Column and Pivot Data Column are optional. Pivot tables are a different way to view data. If you currently use pivot tables to manipulate report data in Microsoft Excel, it is better to select an Excel output and continue using pivot tables in Excel. Note that pivot tables are only suitable for some types of result data.
-
Select the checkboxes to Choose your output format(s). Multiple options may be selected.
-
Select the Calculate grouping subtotals checkbox to add an unlabeled row or column with the subtotals for each grouping and an unlabeled grand total row or column. Note, group subtotals and grand totals will only be useful with some reports.
-
Excel output will create a file to export the data to Excel.
-
CSV Output will create a data file in comma-separated values format. This is the file format required to do a batch load on the Item Status screen.
-
HTML Output creates a simple table view of the data that is viewable in your browser environment. HTML Output is sometimes referred to as tabular output.
-
Bar Chart will create a very simple bar chart of your data. Note, bar charts will only be useful with some reports.
-
Line Chart will create a very simple line chart of your data. Note, line charts will only be useful with some reports.
-
-
Leave the Recurrence and Scheduling options as is unless you are running a recurring report. See Recurring Reports, below.
-
Optionally, enter an email address to send the report completion notification to. By default, this field will contain the email address saved in your staff account. Additional addresses can be added separated by a comma.
The email will contain a link to the password-protected report output. Only staff members with permissions to view reports or have full access to the reporter will be able to open the report output.
-
On the right side of the screen, Choose the Report Folder and Output Folder you would like to save the report and output in and then select Save Report.
-
-
A confirmation will appear in the lower right of the screen indicating that the report has successfully saved.
-
Unless you have set a specific run time, the report will run right away. If your report has not completed after 15 minutes, you may need to contact your system administrator.
-
Once the report is complete, you can view your output. See Viewing Report Output, below.
Report Filters
The filters in a report template allow library staff to set the parameters on which the report runs. The ability to select values for certain filters when running a report means a single report template can be used multiple times to generate reports on slightly different data. For example, the same report template can be used to generate separate lists of items using particular circulation modifiers.
Hardcoded Filters
Hardcoded filters are set when the report template is created. These filters cannot be changed when running a report. Common hardcoded filters include:
| Column | Transform | Action | User Params | Description |
|---|---|---|---|---|
Bibliographic Record → Record ID |
Raw Data |
Not in list |
-1 |
Exclude all records where the bibliographic record ID is -1 which is all pre-cat records. |
Call Number/Volume → Call Number/Volume ID |
Raw Data |
Not in list |
-1 |
Exclude all records where the call number ID is -1 which is all pre-cat records. |
Circulation → Check In Date/Time |
Date |
Is NULL |
Include only items that have not been checked in. |
|
Circulation → Circulating Item → Copy Status → Name |
Raw Data |
Equals |
name of an item status |
Include only items that are in the specified item status. |
Circulation → Fine Stop Reason |
Raw Data |
Not in list |
LOST |
Exclude items that have stopped generating fines because they have been set to lost. |
Item → Is Deleted |
Raw Data |
Equals |
f |
Include only non-deleted items. |
ILS User → Is Deleted |
Raw Data |
Equals |
f |
Include only non-deleted patrons. |
Date Filters
Date filters are generally set up to be a specific date, a specific month, or a date range. Date filters may include tips about how the dates should be entered. For instance, in a date range, the earlier date should always be entered in the first date box.
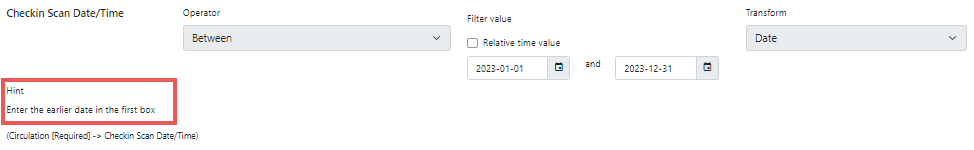
If you’d like to include all possible data for your library in a report that specifies a time range, enter between "1900-01-01" and "today’s date".
The transforms selected for the date filters will also control how users intend to use the results or present the options at the report definition stage.
-
If you want a date picker widget, use the Raw Data or Date transform.
-
If you want to filter based primarily on a comparison between the run time of the report and a timestamp column, use the Date, Month, or Year transform, and select Relative time value.
-
If you want to filter based on the age of the timestamp stored in a column at report run time, use the Age transform.
-
All other transforms have their uses, but the first 3 rules will cover almost all cases.
When running recurring reports, it’s very important to use Relative Dates in your filters. This will allow Evergreen to calculate the time period to report on each time it runs the report. A relative date of 1 month ago will generate a new report each month on the previous month’s data; a real date of November 2022 will generate the same report each month with the data from November 2022.
|
You can set up recurring monthly reports to show comparative data from one year ago. To do this, select relative dates of 1 month ago and 13 months ago. |
Use the Relative time value checkbox under Filter value to switch from a specific real date to a relative date. For a report filtering on month, you will be able to indicate how many months ago the report should look at.
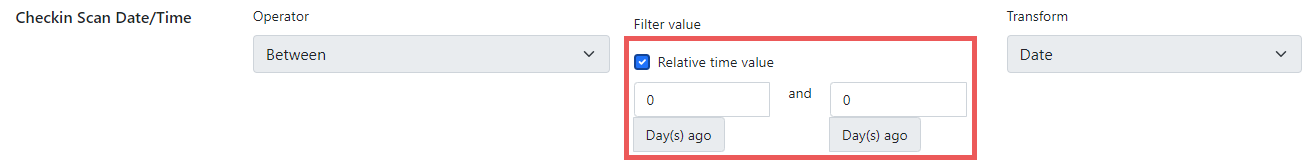
You can use a negative number in the filter value to indicate a future date, e.g., -3 months on the user privilege expiration date field to show users who will expire three months from the date of the report’s run.
Library Filters
All report templates used by libraries should include a library filter. This filter can look at the library specified in a variety of fields in the data including the checkout library, circulation library, owning library, patron’s home library, and organizational unit.
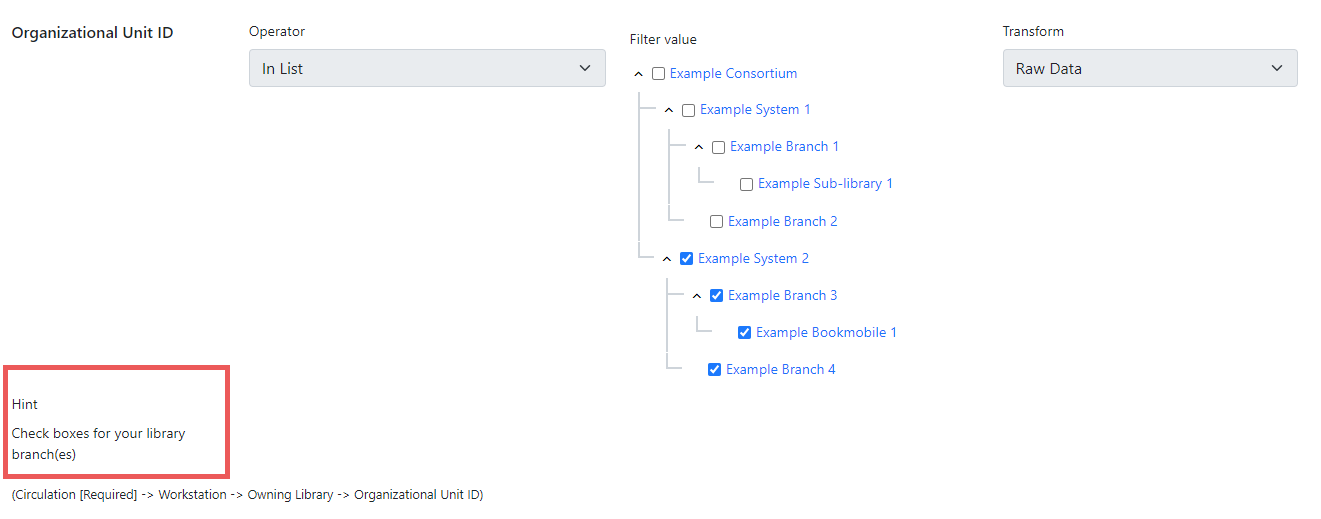
This filter is important as it allows staff to restrict the data in the report output to only data relevant to their library.
Multi-branch libraries can add specific branches or all of their branches to the list to get a report including data from the selected branches.
Other Filters
While many filters will require staff to select values from a given list, some filters will require staff to type a value into the Filter value field. In those cases, field hints, or column documentation, can be used to indicate how the text should be entered so that Evergreen can use the value and generate usable report output.
Some reports will have just hardcoded filters defined at the template level and a single library filter that requires staff to enter a value, while other reports will have multiple filters where staff need to enter values for the library, dates, and patron or item data.
Recurring Reports
Save time by scheduling recurring reports to run your regular reports automatically. Monthly circulation and patron registration statistics are good candidates for recurring reports.
Staff with access to the reporter can set up recurring reports to email a link to the password-protected report output to another staff member.
To set up a recurring report, follow the procedure in Running a Report, above, until you reach the Recurrence and Scheduling sections and then follow the steps below.
-
Select the box for Recurring Report?.
-
In the now visible Recurrence Interval field enter your desired interval. Reports can run on a hourly, daily, weekly, monthly, or yearly interval.
The recurrence interval should correspond to the date filter. For example, if the template filters on a date (month, day, and year) instead of month, a recurring report running with a monthly interval may miss a day or capture an extra day’s data. See Date Filters for more information on working with date filters on a recurring report.
-
Select Schedule Report for Later and in the new date field set the date and time of the first run of the report.
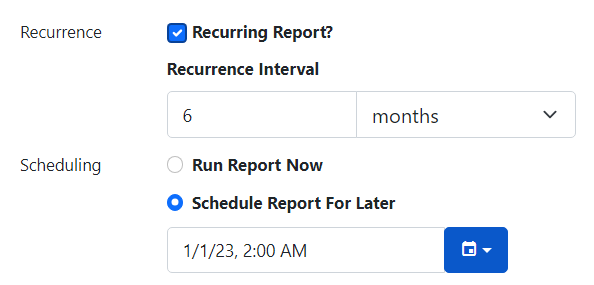
Best practice is to always set recurring reports to run in the early hours of the morning (1:00 a.m. to 4:00 a.m. server time).
Monthly recurring reports must be set to run on the 1st of the next month in order to capture all monthly data.
-
Enter an email address to send the report completion notification to. By default, this field will contain the email address saved in your staff account. Additional addresses can be added separated by a comma.
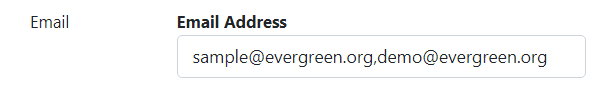
The email will contain a link to the password-protected report output. Only staff members with permissions to view reports or full access to the reporter will be able to open the report output.
-
On the right side of the screen, Choose the Report Folder and Output Folder you would like to save the report and output in and then select Save and Schedule Report.
-
A confirmation will appear in the lower right corner of the screen with Report Saved Successfully.
-
Unless you have set a specific run time the report will run right away. If your report has not completed after 15 minutes, please contact your Evergreen administrator.
-
Once the report is complete you can view your output. See Viewing Report Output , below.
Viewing Report Output
Once a report is finished, the output is stored in the specified Outputs folder and will remain there until deleted. Your system administrator may have a script that automatically deletes report output after a certain period of time.
If an email address was included in the report definition, Evergreen will send an email containing a link to the password-protected report output. Only staff members with permissions to view reports or full access to the reporter will be able to open the report output in either the staff client or via the email link.
complete depending on the size of the report. If your report still shows as pending in your output folder after 15 minutes, you may need to contact your system administrator.
Viewing Output via the Reports Interface
-
Navigate to Administration → Reports.
-
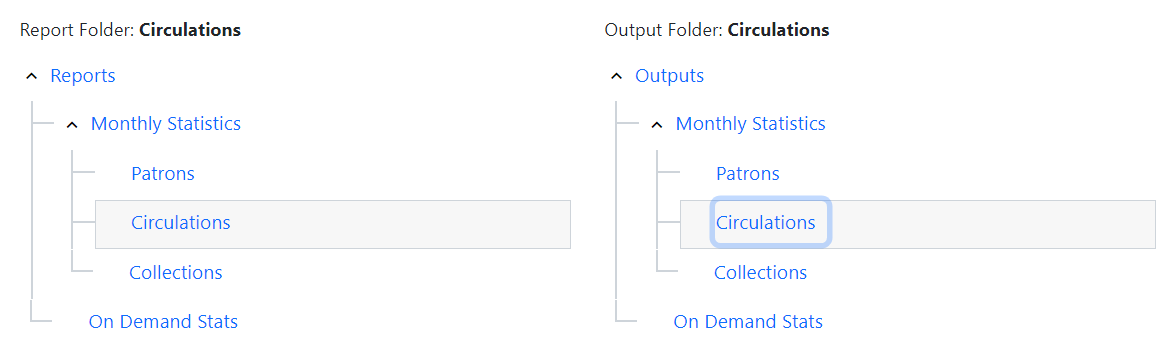
In the My Folders section select the caret beside the Outputs folder to see your output folders. Use the carets to expand the folder tree until you find the folder containing the output you’d like to view.
-
Select the folder name to display the contents.
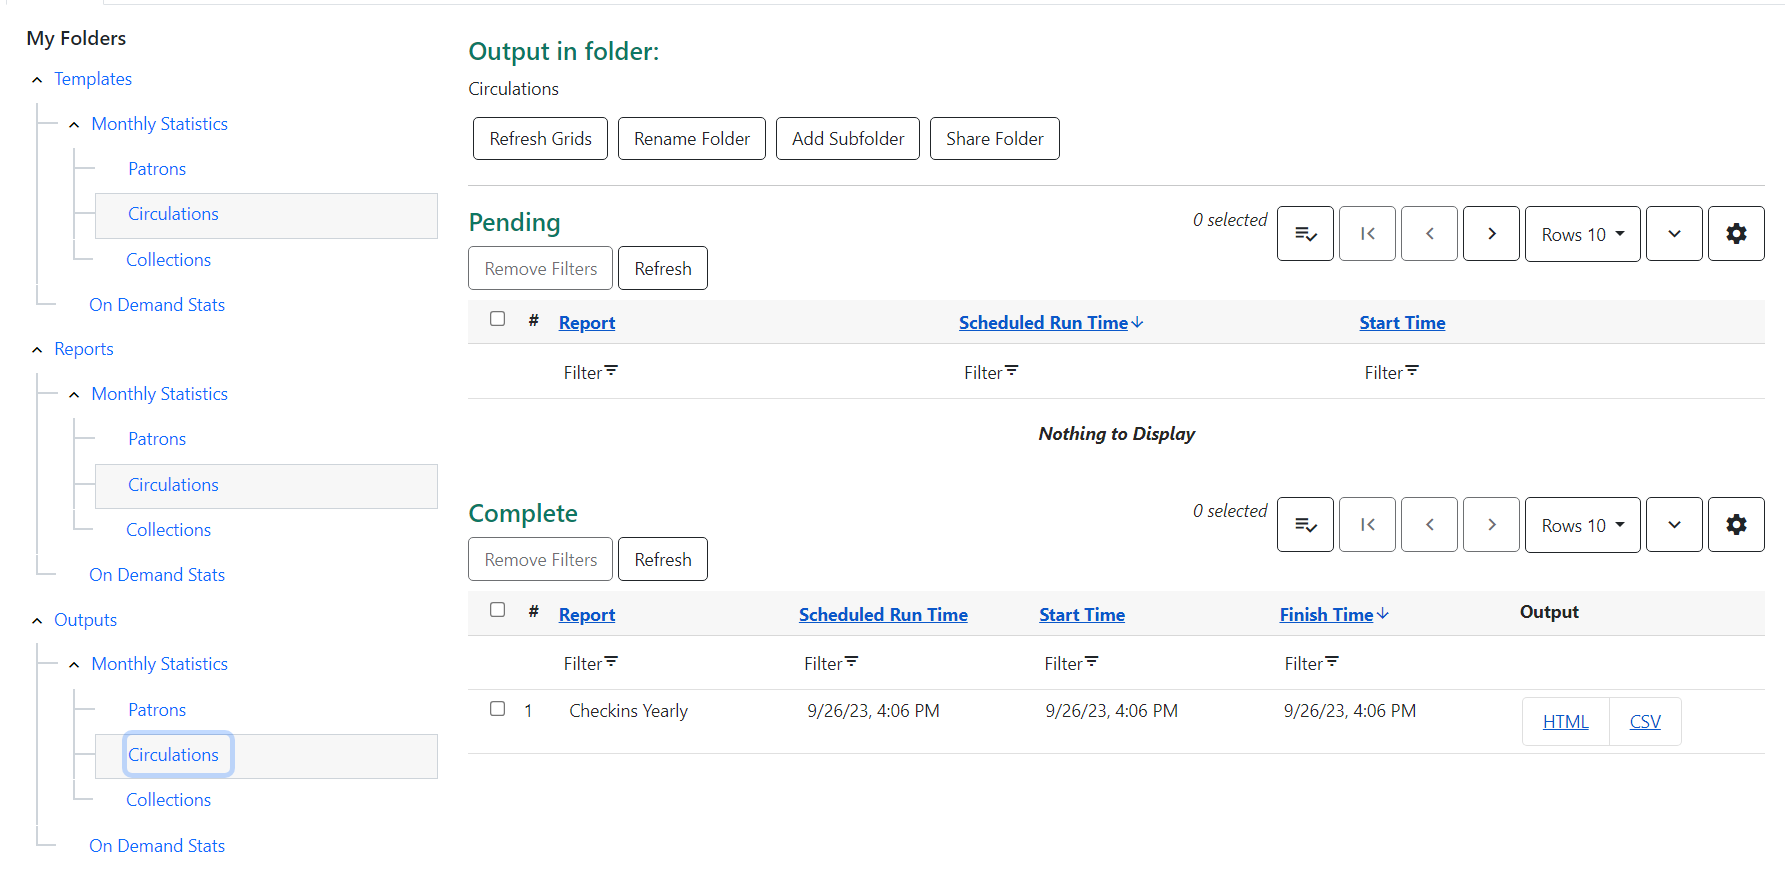
-
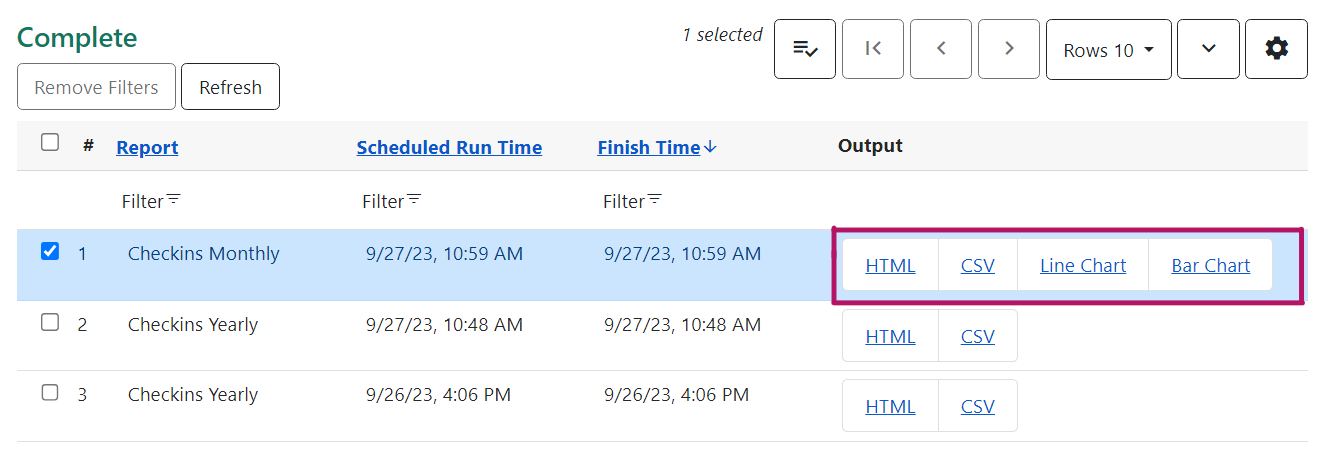
Output will display either under Pending or Complete. Use the Refresh Grids button at the top of the screen or the Refresh button under each section if your output hasn’t completed yet.
-
Double click on the line for the output you would like to view or check the box beside the completed output you would like to view and right click or use the Actions menu to View Output.
-
The report output will open in a new browser tab.
-
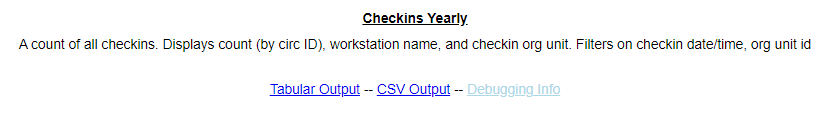
The report name and description will display as well as links to the output options you selected when running the report. The URL can be shared with other library staff who have reporter permissions.
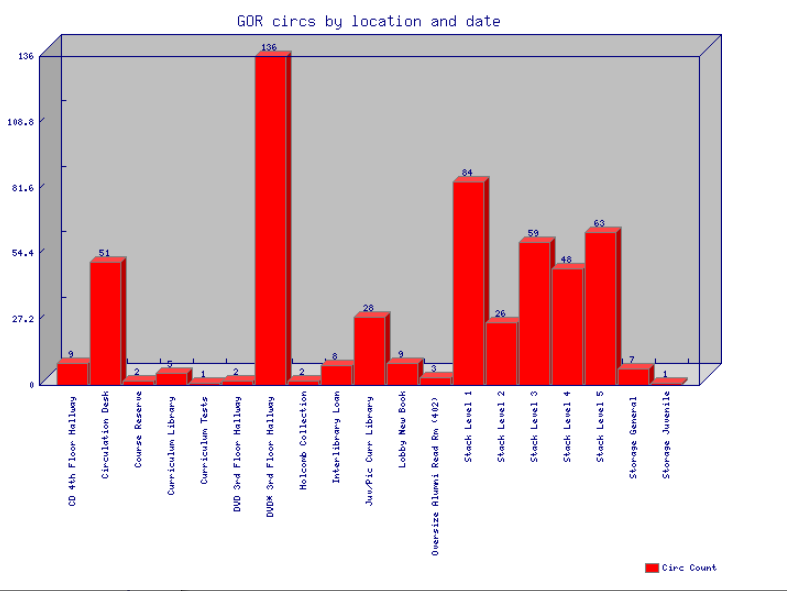
If Bar Charts and/or Line Charts were selected in the output options and the data can be shown in those forms, the bar and/or line chart will display.
-
Select Excel Output or CSV Output to download the output as a file that can be opened in a spreadsheet program.
-
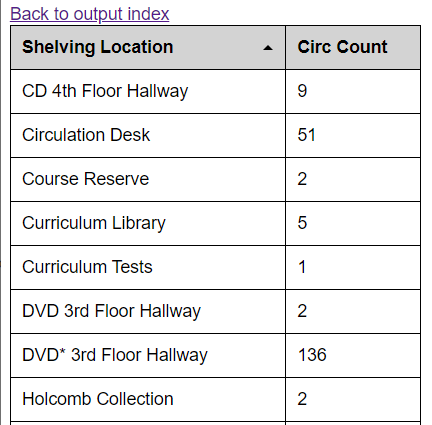
Select Tabular Output to view the output in the browser. The Tabular Output is the same as the HTML Output selected at the report definition level. The tabular output will display and can be sorted by selecting a column heading.
On the Outputs folder view of completed outputs, the buttons under the Output column will allow you to interact with the various files and views without first having to use the View Output option to open a new tab.
Viewing Output via the Email Link
-
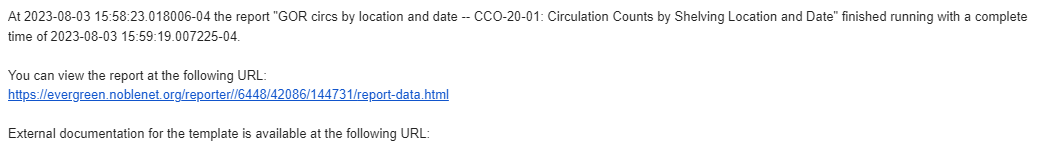
In your email program open the email with the subject Report finished: <Your report name - template used>.
-
The body of the email will include the run time, the name of the report, the name of the template used for the report, the URL for accessing the report, and in some cases a URL for documentation related to the report template.
-
-
Select the report URL.
-
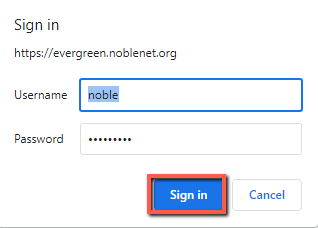
A pop-up will appear asking for your Evergreen staff username and password. Enter your credentials and select Sign In.
Opening subsequent report URLs will not prompt for an additional sign-in until the browser is closed.
Staff accounts without permissions to use the reporter or view report output will not be able to sign in.
-
The report output will open in a new browser tab. The report name and description will display as well as links to the output options selected when running the report. The URL can be shared with other library staff who have reporter permissions. From here the display and options will behave as described above in Viewing Report Output.
Maintaining Reports Data
Saved report templates will stay in the database forever unless deleted by the template owner. Check with your system administrator to determine whether report definitions and outputs are deleted on a scheduled basis.
When a template or report definition is deleted, all the linked definitions and output files are also deleted. If you have shared your template and/or created a recurring report using your template, you will not be able to delete your template. This is why it is important for all users to clone templates into their own folders before running reports.
It is recommended that you download outputs you need to keep as CSV or Excel output and save it locally on your computer hard drive or a shared drive.
Maintaining Your Report Templates
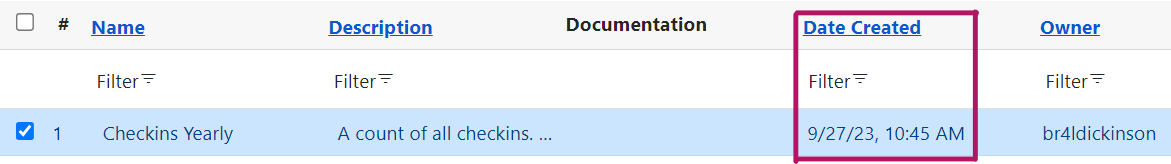
As Evergreen evolves from version to version, the database tables sometimes change, and report templates should be periodically reviewed to ensure that they are running correctly and efficiently. It is especially recommended to review templates following an upgrade. You can check the create time of a template in the template folder grid.
If you are modifying existing templates or creating your own templates, it is recommended that you delete any interim versions of the template created while working towards the final version of the template. This makes it easier to be sure you are using the correct version of the template.
|
System Administrators should periodically review the scheduled and common reports and shared templates to ensure consistent usage. An example of a report to show templates in use can be seen on the Evergreen Reports Wiki. |
Deleting a Report Template
|
Deleting a template will delete all report definitions and outputs linked to the template. Make sure any data you need to keep is downloaded and saved locally before deleting. |
-
Navigate to Administration → Reports.
-
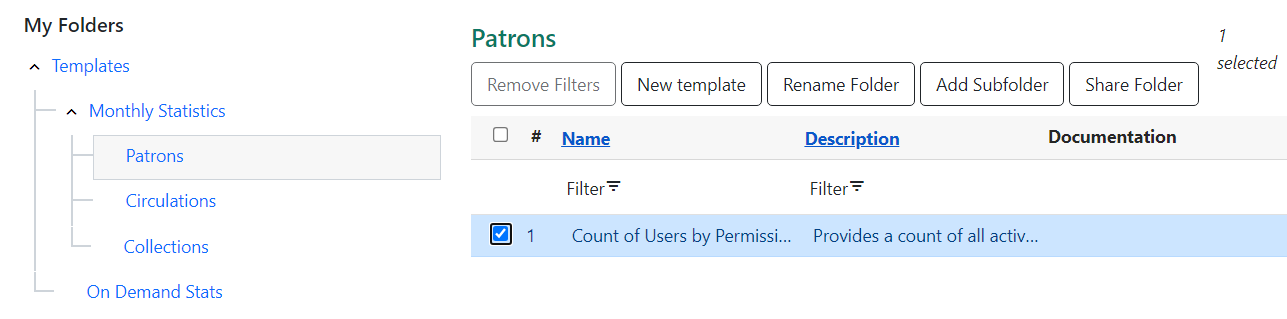
In the My Folders section select the caret beside the Templates folder to see your template folders. Continue to use the carets to expand the folder tree until you find the folder containing the template(s) you would like to delete.
-
Select the folder name to display the contents.
-
Select the box beside the template(s) you wish to delete.
-
Right click on the selected line or use the Actions menu and select Delete Selected.
-
A pop-up will appear warning you that deleting the template will delete your attached reports and output. Select Confirm.
-
A confirmation will be displayed in the lower right corner of the screen.
|
If you have shared your template and/or created a recurring report from your template, you will not be able to delete your template until those reports have been deleted. This is why it is important for all users to clone templates into their own folders before running reports. |
Viewing a Report Definition
You can view the report definitions for the reports you’ve run. This can be helpful if you need to check what values you entered in for the filters.
-
Navigate to Administration → Reports.
-
In the My Folders section, select the caret beside the Reports folder to see your reports folders. Continue to use the carets to expand the folder tree until you find the folder containing the report you would like to view.
-
Select the folder name to display the contents.
-
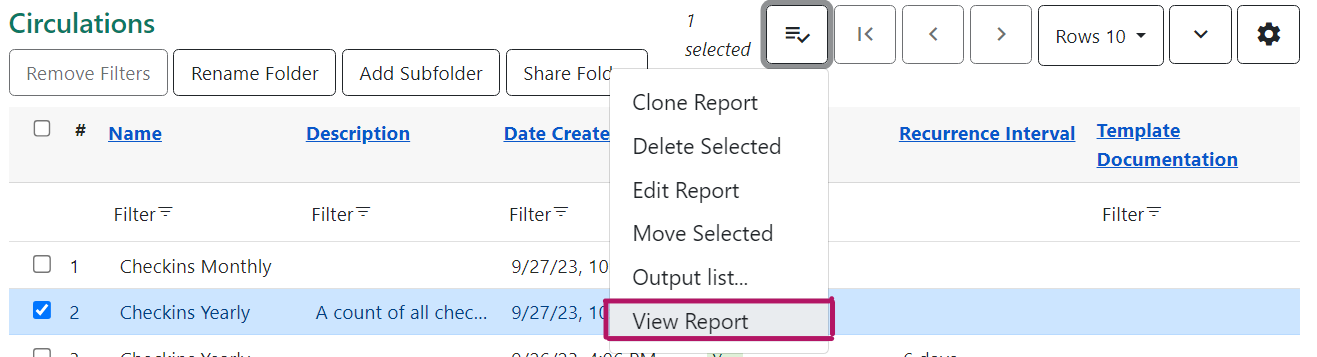
Select the View link beside the report definition you would like to view.
-
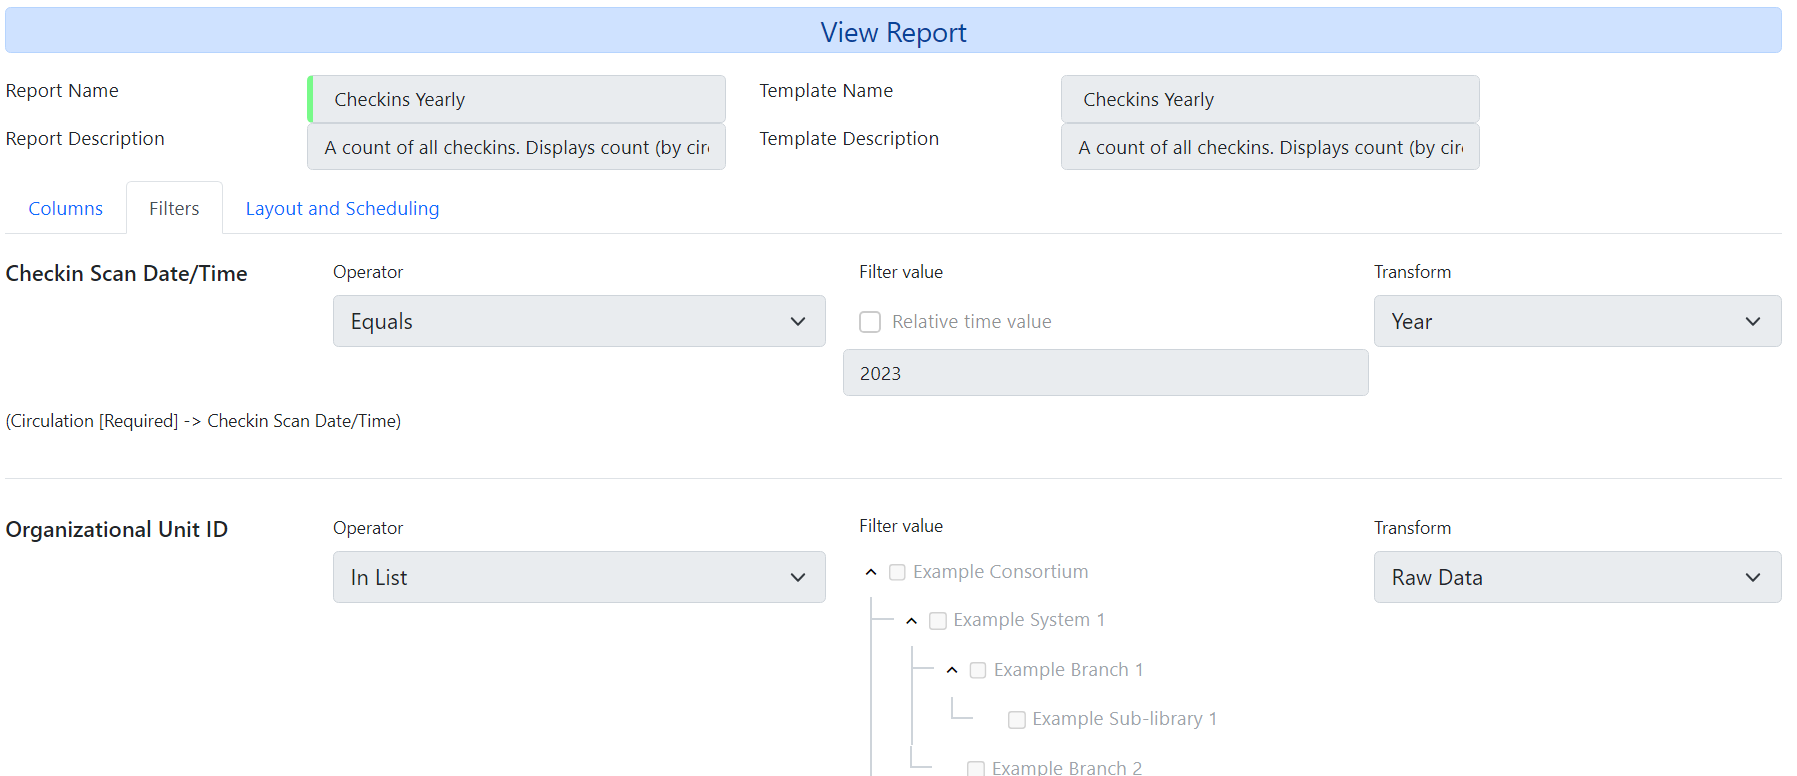
The report definition will display, and you can view the information that was entered. The fields are grayed out as they cannot be edited from this screen.
Editing a Report Definition
You can edit the report definitions for reports you’ve run; this will change the report definition for any future scheduled runs. To make a new, additional, version of the report, you should clone the report. This functionality was previously done with a Save as New button in the old reporter.
To edit a report for future scheduled runs:
-
Navigate to Administration → Reports.
-
In the My Folders section select the caret beside the Reports folder to see your reports folders. Continue to use the carets to expand the folder tree until you find the folder containing the report you would like to view.
-
Select the folder name to display the contents.
-
Select the line for the report you wish to modify. Right click or use the Actions menu to select Edit Report.
-
The report definition will display, and you can edit the values entered as desired.
-
Once edits are complete, select Save or Save and Schedule Report.
|
The button options, Save and Save and Schedule Report, have slightly different functions. Save just saves the edited/updated report definition but Save and Schedule creates a new run of the report as well. With Save and Schedule, the existing future run will be removed and a new one will be created in its place, with the new scheduling and output options that are selected. |
To create a new version of the report:
-
Navigate to Administration → Reports.
-
In the My Folders section select the caret beside the Reports folder to see your reports folders. Continue to use the carets to expand the folder tree until you find the folder containing the report you would like to view.
-
Select the folder name to display the contents.
-
Select the line for the report you wish to modify. Right click or use the Actions menu to select Clone Report.
-
The report definition will display, and you can edit the values entered as desired.
-
Your report must have a unique name. The system will automatically add (Clone) to the end of the report name. This can be removed, and the report renamed as desired.
-
Once edits are complete, select Save and Schedule Report
Moving Report Definitions and Output
Templates, report definitions, and report outputs can all be moved between the folders you have created under My Folders.
-
Navigate to Administration → Reports.
-
In the My Folders section select the caret beside the Reports folder to see your reports folders. Continue to use the carets to expand the folder tree until you find the folder containing the report you would like to view.
-
Select the folder name to display the contents.
-
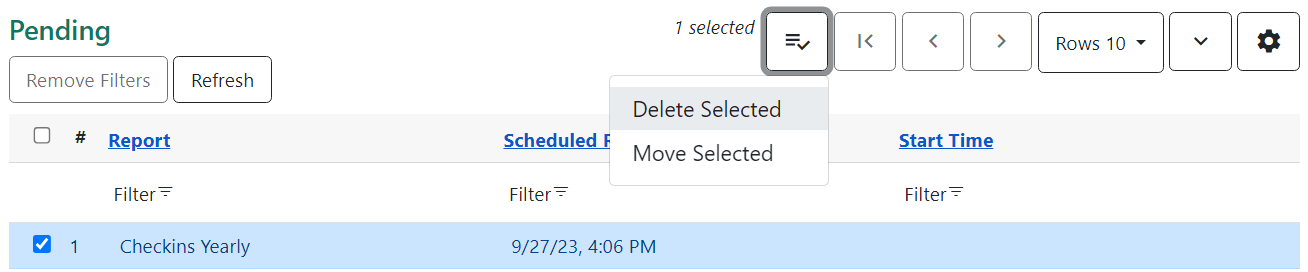
Select the line for the report(s) you wish to move. Right click or use the Actions menu to select Move Selected.
-
A popup will open and show the current folder as well as the folder tree so t hat you can select the destination folder.
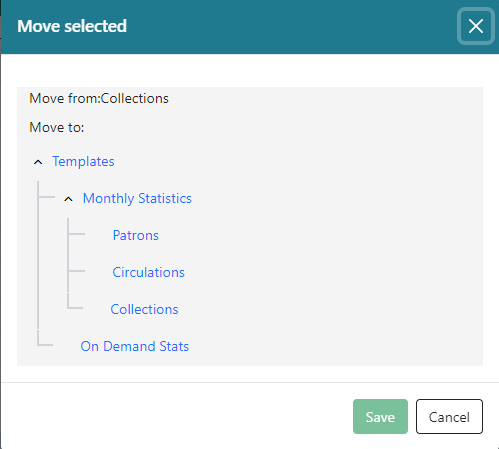
-
Select Save. A confirmation of the move will be displayed in the lower right corner of the screen.
Deleting Report Definitions and Output
Report definitions and output that you no longer need can be deleted from within the appropriate reports or output folder.
|
Before deleting, ensure that any needed report output has been downloaded and saved locally. Reports that capture a historic snapshot or moment in time, such as a count of items in each shelving location, or a count of patrons on a past date, cannot be re-created. |
-
In the appropriate Reports or Outputs folder, select the box for the definition(s) or output(s) you wish to delete.
-
Right click or use the Actions menu to select Delete selected.
-
A confirmation pop-up will open asking for confirmation that you want to delete the report and associated outputs. Click Confirm.
-
A message appears in the bottom right of the screen confirming the report definition and output has been deleted.
Recurring reports can be stopped by deleting the relevant report definition or the pending output.